


Sizing the College Application Portfolio
The undergraduate admissions ecosystem in the United States has undergone a structural transformation over the past two decades. The widespread adoption of centralized digital application platforms, the rapid expansion of test-optional policies, and heightened applicant anxiety regarding institutional selectivity have collectively triggered unprecedented application inflation. Data from the Common Application reveals that during the 2024–2025 admission cycle, first-year application volume surpassed 10 million for the first time, reflecting an 8% year-over-year increase, while the average number of applications submitted per student rose to 6.80. Recent deadline data from early 2026 confirms that this upward trajectory remains uninterrupted, with mid-season averages hovering between 6.56 and 6.59 applications per student.
This surge in application volume has created a self-reinforcing feedback loop. As students submit more applications to mitigate perceived admissions volatility, universities experience a massive influx of files. To protect yield rates—the percentage of admitted students who ultimately choose to enroll—institutions increasingly rely on early admission rounds and expanded waitlists, which in turn fuels further applicant anxiety and drives list expansion.
Faced with this complex landscape, applicants often struggle to determine the optimal size of their college lists. Simplistic advice advocating for a fixed number of applications fails to account for the unique academic, financial, geographic, and programmatic variables that shape individual circumstances. Constructing a highly optimized college application portfolio requires a systematic approach, shifting the focus from arbitrary numerical targets to strategic balance, risk mitigation, and institutional fit.
Understanding the Institutional Landscape: Why No Universal Target Exists
Admissions professionals and counseling organizations consistently decline to prescribe a single, universal target for college lists. The National Association for College Admission Counseling (NACAC) and the College Board historically suggest that a portfolio of five to eight applications is generally sufficient to guarantee admission to a suitable institution. However, regional planning bodies, such as the Massachusetts Educational Financing Authority (MEFA), note that while six to eight schools is a common baseline, many students benefit from targeting eight to twelve institutions to balance specific programmatic and financial aid needs.
The divergence in expert recommendations stems from the fundamental structural differences between individual student profiles and institutional admissions practices. A student targeting local public universities with transparent, index-based admissions criteria faces a highly predictable outcome, requiring fewer applications. Conversely, a student targeting highly selective private institutions operating under holistic review processes must expand their list to hedge against the inherent unpredictability of elite admissions.
Table 1 outlines the recommended application ranges proposed by prominent educational advising and counseling organizations, reflecting how institutional context alters portfolio design.
Portfolio Range Recommendations by Educational Advising Organizations
| Organization | Recommended Range | Core Strategic Emphasis |
|---|---|---|
| College Board (BigFuture) | Minimum of 6 Colleges | Highly structured baseline balancing Reach, Match, and Safety categories. |
| NACAC | 5 to 8 Colleges | Minimizing application fatigue while ensuring access to a suitable match. |
| MEFA (Massachusetts) | 8 to 12 Colleges | Maximizing financial aid options and accounting for specialized academic programs. |
| Collegewise | 6 to 12 Colleges | Optimizing student bandwidth to produce highly customized, competitive applications. |
| IvyWise | 13 to 15 Colleges | Broader diversification for students targeting highly competitive, low-admit institutions. |
The Nuanced Taxonomy of Admissions Risk: Reach, Target, and Safety
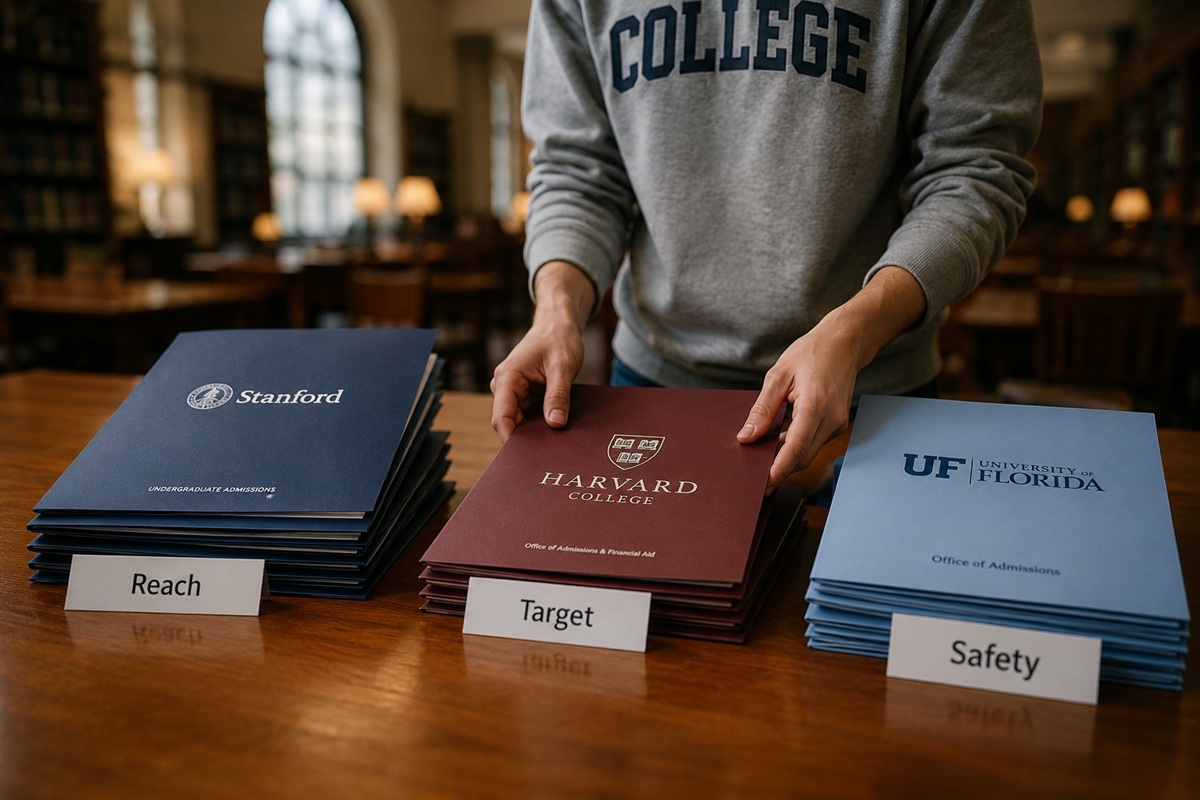
The foundation of a balanced college list is the classification of institutions into distinct categories of admissions probability: Reach, Target (or Match), and Safety (or Probable). Misclassifying these institutions is one of the most common structural errors in list assembly, often leading to disappointing outcomes.
A critical rule of modern admissions is that highly selective universities—defined as those with overall acceptance rates below 20%, including the Ivy League, Stanford, MIT, and Caltech—can never be classified as target or safety schools, regardless of the applicant’s academic credentials. At these elite levels, the volume of academically qualified applicants vastly exceeds the available seating. With institutions like Harvard posting acceptance rates of approximately 3%, and the entirety of the Ivy League admitting fewer than 9% of applicants, admissions decisions become highly idiosyncratic and statistically uncorrelated.
To construct a robust portfolio, applicants must categorize institutions using a combination of historical admissions data, standardized testing percentiles, and high school GPA distributions.
Taxonomic Parameters of the Reach-Match-Safety Framework
| Category | Institutional Acceptance Rate | Student Academic Position | Portfolio Representation |
|---|---|---|---|
| Reach (Dream) | <20% overall, or highly competitive | GPA and test scores are in the lower 25th percentile of the admitted class, or the school is highly selective | 1 to 3 schools (up to 5 for elite lists) |
| Target (Match) | ~30% to 60% | GPA and test scores align with the median 50th percentile of the admitted class | 3 to 5 schools |
| Safety (Probable) | >50% (ideally >80%) | GPA and test scores significantly exceed the 75th percentile of the admitted class | 2 to 3 schools (including financial safeties) |
A true safety school must meet two criteria: there must be a near-certain statistical probability of academic admission, and the institution must be highly likely to be financially viable for the family. Many counseling professionals recommend including a local public flagship or a community college within this category to guarantee a viable pathway.
Target (or Match) schools are frequently overlooked by applicants who chase prestige, yet these institutions represent the academic and social sweet spot. Many students ultimately enroll at match schools because these institutions align perfectly with their credentials while offering robust campus engagement, practical career pipelines, and competitive institutional aid packages.
How Intended Major Changes the Equation: Computer Science vs. History
One of the most consequential, yet frequently overlooked, variables in portfolio design is the impact of the applicant’s intended major. At universities that utilize “admit-by-major” or “direct-admit” policies, the overall institutional acceptance rate is highly misleading. Under these systems, highly competitive and capacity-constrained departments—most notably Computer Science, Engineering, Business, Nursing, and the Performing Arts—operate under distinct, far more rigorous admissions thresholds.
This structural difference is clearly illustrated when contrasting an applicant intending to major in Computer Science with one majoring in History. An applicant targeting a capacity-constrained Computer Science department faces an uphill statistical battle. At the University of Illinois Urbana-Champaign (UIUC), the direct-admit Computer Science program accepts only about 6% of applicants, whereas the university’s overall acceptance rate is approximately 45%. Under these parameters, a Computer Science applicant must treat UIUC as an extreme Reach, constructing a broader portfolio that includes numerous direct-admit safety nets to guarantee a computer science pathway.
Conversely, an applicant targeting a History major within the humanities faces a completely different admissions environment. History departments are rarely capacity-constrained. At universities like UIUC or Cornell, a humanities applicant is evaluated under general liberal arts thresholds, which often align closely with the overall institutional acceptance rate. Because major declaration for history students typically occurs later in their sophomore year, these applicants face highly predictable admissions pathways. Consequently, the history applicant can construct a much smaller, more focused college list, as their target schools represent true, statistically reliable matches.
Comparative Acceptance Rates: Highly Competitive Majors vs. General Admissions
| Institution | Capacity-Constrained Major/School | Major Acceptance Rate | Overall Institutional Acceptance Rate | Gap Factor |
|---|---|---|---|---|
| Carnegie Mellon University | School of Computer Science (SCS) | <5% | 11% | ~2.2X |
| UC Berkeley | Electrical Eng. & Computer Sciences (EECS) | <5% | 11.7% | ~2.3X |
| University of Washington | Computer Science (Out-of-State) | 2% to 5% | 46% (Out-of-State) | ~9.2X to 23X |
| Univ. of Illinois Urbana-Champaign | Computer Science (Direct Admit) | 6% | 45% | ~7.5X |
| University of Pennsylvania | Wharton School of Business | ~5.4% | ~7.5% (Arts & Sciences) | ~1.4X |
The programmatic structure also influences the path after matriculation. At some institutions, students not admitted directly to their major enter as undeclared and must navigate competitive, capacity-constrained secondary application processes during their sophomore year. At the University of Washington, for example, students who are not admitted directly to the Allen School of Computer Science & Engineering are explicitly advised that transferring into the major later is highly unlikely, forcing many rejected applicants to change their field of study or transfer out of the university entirely. Consequently, STEM, business, and nursing applicants must expand their portfolios to include a broader array of direct-admit programs to secure their desired academic pathway.
Financial Safeties vs. Admissions Safeties
A college list that balances academic admissions probability but ignores financial reality is fundamentally flawed. In the contemporary higher education economy, a school can easily represent an academic safety while being a profound financial reach. Financial planning must be integrated into the portfolio design phase, rather than deferred until admissions decisions arrive.
The actual out-of-pocket cost of an institution, known as the net price, rarely matches its published sticker price. To systematically identify financial safeties, families must utilize institutional Net Price Calculators (NPCs). These federally mandated tools allow families to input financial and household data to generate an estimated financial aid package, subtracting federal, state, and institutional grants from the total cost of attendance.
When designing a list for affordability, applicants must evaluate the aid philosophy of each institution:
- Full-Need-Met Institutions: These colleges commit to meeting 100% of a student’s demonstrated financial need, primarily through non-repayable grants. While these schools—predominantly elite private universities and select liberal arts colleges—are highly generous, they are also highly selective and rarely offer merit-based aid.
- Merit-Driven Institutions: Many regional private universities and public out-of-state flagships use merit aid aggressively to attract high-achieving applicants. Students whose academic profiles fall in the top 25% of the admitted class are often awarded substantial merit scholarships, significantly driving down the net price.
- State Promise and Reciprocity Programs: Many states offer robust safety nets that guarantee tuition coverage for qualifying residents. For example, the MASSGrant and MASSGrant Plus programs in Massachusetts cover the full cost of tuition and mandatory instructional fees for income-eligible students attending the state’s public four-year universities and community colleges.
A highly strategic list must include at least one or two “sure-fire” financial safeties—institutions that are guaranteed to be affordable even in the absence of competitive institutional aid.
Geographic Restrictions and Personal Preferences
The spatial boundaries of a college search are often dictated by geographic preferences, family obligations, and financial constraints. These personal parameters exert a powerful influence on the ultimate size and structure of the application list.
A significant portion of college applicants express a strong desire to stay in-state or remain close to home, often to maintain proximity to family networks or to fulfill local obligations. This narrow geographic focus structurally limits the number of viable four-year institutions available. When restricted to a specific metropolitan area or a single state, an applicant cannot easily construct a sprawling list of fifteen or twenty schools without including institutions that fail to meet their qualitative or programmatic desires.
Under these geographic constraints, list construction requires a highly calculated approach. Because the absolute number of options is restricted, the applicant must ensure that the few regional institutions on the list are carefully balanced. If the local public flagships represent highly competitive environments, the student must integrate regional public universities, commuter campuses, or community colleges to serve as reliable academic and financial safeties.
Conversely, a student who is geographically unconstrained can expand their list to compare regional financial aid incentives, though they must still guard against the qualitative dilution of their applications.
The Specialty Sector: Designing Lists for Transfer Students
The strategic considerations for community college and four-year university transfer students differ fundamentally from those of first-year applicants. More than one in three college students will transfer at least once before earning their baccalaureate degree, and approximately 80% of community college students matriculate with the explicit goal of eventual upward transfer. Despite these large numbers, transfer admissions are frequently governed by highly specialized institutional parameters that dictate list size.
A primary error among transfer applicants is targeting only a single, highly selective “dream” institution. Applying to a single school leaves the applicant vulnerable to a complete shutout and deprives them of valuable feedback on how different universities evaluate their existing college credits. To mitigate this risk, transfer students should construct a targeted portfolio of three to six institutions, balancing elite targets with highly receptive public universities.
Transfer selectivity varies dramatically across institutional sectors. Highly selective private universities often maintain exceptionally tight transfer caps due to high freshman retention rates. For example, Harvard University admits less than 1% of transfer applicants, and MIT maintains a highly competitive transfer acceptance rate of just 1.9%.
Conversely, many top-tier public universities and select private institutions are highly transfer-friendly, often utilizing transfer cohorts to fill capacity vacated by sophomore attrition. Boston University, for instance, exhibits a transfer acceptance rate of approximately 35% compared to its first-year rate of 11%, while UCLA admits roughly 23% of transfers compared to a 9% first-year rate.
Transfer Selectivity vs. First-Year Selectivity at Select Institutions
| Institution | Transfer Acceptance Rate | First-Year Acceptance Rate | Transfer List Implication |
|---|---|---|---|
| Harvard University | <1% | ~3%-4% | Extreme reach; highly restricted capacity. |
| MIT | 1.9% | 4.6%-5% | Highly competitive; requires exceptional alignment. |
| Boston University | 35% | 11% | Favorable target; highly receptive to transfers. |
| UCLA | 23% | 9% | Robust public pathway; highly structured. |
| USC | 25% | <12% | Accessible option with strong credit pathways. |
Furthermore, the predictability of transfer admissions is heavily enhanced by formal articulation agreements. These agreements—established primarily between community colleges and state university systems—provide clear, programmatic maps detailing which credits are guaranteed to transfer. When an applicant utilizes an established articulation pathway, the administrative uncertainty of transferring is minimized, allowing for a much smaller and highly secure application list.
Hidden Costs of Portfolio Inflation
The temptation to expand one’s college list to fifteen, twenty, or more schools is fueled by the false assumption that more applications linearly increase the probability of a desirable outcome. In reality, the strategic benefit of list expansion peaks rapidly, giving way to a pronounced law of diminishing returns.
The most immediate constraint is the qualitative erosion of the application itself. While centralized platforms facilitate the submission of the primary personal statement, highly selective institutions require school-specific supplemental essays to gauge institutional fit, academic focus, and demonstrated interest. An applicant targeting twenty selective universities can easily face an administrative burden of forty to sixty unique supplemental essays.
Maintaining an elite level of writing across such a massive volume is virtually impossible for most high school seniors, who must also balance academic coursework and extracurricular commitments. Rushed, generic, or recycled essays are highly transparent to experienced admissions officers and frequently lead to rejection.
Beyond qualitative decline, portfolio inflation carries significant hidden systemic risks:
- Financial Capital Expenditure: With typical college application fees ranging from $50 to $90 per school, a twenty-school list can cost up to $1,800 in submission fees alone, exclusive of standardized test score report fees and CSS Profile financial aid document fees. While fee waivers exist for low-income and first-generation applicants, middle-class families must absorb these significant upfront costs.
- The Yield Defense Waitlist Phenomenon: Educational data confirms that over-applying actively triggers waitlist placements. A study conducted by Niche demonstrated that students who apply to sixteen or more colleges have a greater than 70% chance of being waitlisted at least once. Because selective colleges track demonstrated interest—such as campus visits, webinar attendance, and email engagement—via customer relationship management (CRM) software, they quickly identify “ghost applicants” who have submitted applications but have not meaningfully engaged with the school. To protect their yield, admissions committees will waitlist highly qualified applicants whom they suspect are using the institution as a backup.
- Decision Paralysis: Receiving numerous admissions offers can paradoxically complicate the enrollment process. It compresses the time available for families to conduct post-admission campus visits, compare financial aid award letters, and evaluate academic programs before the national May 1 commitment deadline.
The Risks of Under-Applying
While portfolio inflation introduces severe qualitative and logistical strain, applying to too few colleges presents an equally hazardous set of strategic risks. When a student restricts their list to only one or two competitive institutions, they dramatically elevate the probability of a total admissions shutout, leaving themselves with zero viable enrollment options.
This risk is particularly acute for students who fall prey to prestige bias, constructing lists comprised exclusively of highly selective reach schools. Because elite admissions outcomes are highly volatile and largely decoupled from raw academic metrics, even an applicant with a perfect academic profile faces a high probability of rejection at these institutions. Without a foundational layer of true academic safeties, under-applying can completely derail a student’s educational trajectory, forcing them to scramble for rolling admissions or community college alternatives late in the cycle.
Furthermore, small lists structurally undermine a family’s financial leverage. Since the actual net cost of an institution is not finalized until financial aid award letters are delivered, applying to a narrow list of schools prevents families from comparing competing financial aid and merit scholarship packages. A student who receives admission to only a single, unaffordable institution is left with no leverage to negotiate or pivot, whereas a student with multiple peer acceptances can compare net price offers and make a financially sustainable decision.
Strategic Portfolio Design
To illustrate how these strategic variables interact in practice, Table 5 presents four distinct, realistic applicant profiles. These archetypes demonstrate how list size and composition must be engineered based on academic goals, field of study, financial parameters, and institutional selectivity.
Portfolio Allocation by Student Profile
| Student Profile | Total Applications | Safety/Probable | Target/Match | Reach/Dream | Strategic Rationale |
|---|---|---|---|---|---|
| Student A: Regional In-State Pragmatist | 6 to 8 Schools | 2 schools | 3 to 4 schools | 1 to 2 schools | High predictability due to transparent state university admissions; optimized for local in-state tuition and state grant eligibility. |
| Student B: Highly Competitive STEM Specialist | 10 to 15 Schools | 3 schools | 4 to 6 schools | 3 to 6 schools | Mitigation of low major-specific acceptance rates in Computer Science/Engineering; lists are balanced with direct-admit public flagships. |
| Student C: Merit Aid & Cost Optimizer | 12 to 16 Schools | 3 to 4 schools | 5 to 8 schools | 2 to 4 schools | Designed to maximize institutional discounting; larger list allows the family to leverage and compare competing merit scholarship offers. |
| Student D: Ivy-Plus & Elite Applicant | 12 to 18 Schools | 3 schools | 4 to 6 schools | 5 to 9 schools | High academic profile; list requires extensive reach diversification to hedge against highly volatile, single-digit acceptance rates. |
Student A: The Regional In-State Pragmatist
This applicant seeks a high-quality education while minimizing student debt and remaining close to home. Because their target state institutions employ relatively straightforward, merit- or index-based admissions criteria, the statistical uncertainty is low. Consequently, a streamlined portfolio of six to eight schools is highly appropriate. The safety and target schools are typically regional public flagships or community colleges, where admission is highly probable and costs are structurally contained.
Student B: The Highly Competitive STEM Specialist
This student is targeting highly sought-after Computer Science or Engineering programs. Because these disciplines are heavily capacity-constrained, the applicant faces double-digit discrepancies between the university’s overall acceptance rate and the department’s actual admissions rate. To secure a direct-admit seat, the portfolio must be expanded to ten to fifteen schools. The list must bypass general target schools in favor of institutions that offer transparent, direct-admit pathways to the major, ensuring the student does not get shut out of their intended career path.
Student C: The Merit Aid and Cost Optimizer
For this family, financial need or the desire to avoid substantial educational debt is the primary driver of the search. While Net Price Calculators provide baseline estimates, they often fail to capture the highly competitive merit-based scholarships awarded to top-tier applicants. In this scenario, applying to a slightly larger list of twelve to sixteen schools is strategically sound. By targeting mid-tier private universities and out-of-state public flagships where the student’s academic credentials fall in the top 10% of the applicant pool, the family can compare competing, multi-year merit aid packages to find the most affordable option.
Student D: The Ivy-Plus and Elite Applicant
This student possesses a top-tier academic profile (GPA > 3.9 unweighted, SAT > 1550) and is aiming for highly selective research universities and elite liberal arts colleges. Because these institutions utilize holistic review and admit fewer than 10% of applicants, they represent lottery-like probabilities for even the most accomplished students. To mitigate this volatility, a list of twelve to eighteen schools is often required. However, to execute this strategy successfully, the applicant must have exceptional time management skills to ensure that the supplemental essays for each school remain highly personalized and compelling.
Myth-Busting: Deconstructing Pervasive Admissions Misconceptions
As application volumes escalate, several pervasive myths continue to misguide applicants, leading to unbalanced lists and suboptimal outcomes.
Myth: More Applications Always Improve Your Admission Chances
The belief that applying to twenty or more colleges increases the overall probability of admission assumes that admissions is a randomized lottery. It is not. Admissions decisions are highly correlated, particularly among highly selective institutions that look for similar profiles of academic rigor, leadership, and institutional fit. If an applicant’s portfolio contains structural deficiencies—such as a lack of course rigor or generic, poorly crafted essays—applying to twenty elite colleges will simply yield twenty rejections.
Myth: Everyone Should Apply to 20+ Colleges
Centralized platforms like the Common App cap application accounts at twenty institutions. Maxing out this limit is rarely a strategic move. It almost always results in severe application fatigue, leading to a decline in essay quality and a failure to demonstrate meaningful interest to the targeted schools. Admissions offices easily identify rushed, copy-paste applications and routinely reject them.
Myth: Safety Schools Are Unnecessary for Top-Tier Students
Academically outstanding students often fall into the trap of believing that safety schools are unnecessary or represent a personal failure. In a holistic admissions ecosystem where perfect-score applicants are regularly denied at highly selective institutions, no student is immune to rejection. Failing to include multiple, genuinely appealing safety schools can result in a complete shutout, leaving the student with no enrollment options when decisions are released.
Myth: A College’s Overall Acceptance Rate Tells the Whole Story
Relying solely on a university’s published overall acceptance rate can lead to catastrophic list-building errors. As demonstrated by major-specific data, a university that appears to be a reasonable target with a 30% overall acceptance rate can easily be an extreme reach if the student’s chosen major has a sub-5% acceptance rate. Admissions decisions must always be analyzed through the specific lens of major-specific selectivity and regional residency quotas.
Myth: You Should Apply to Every School Available on the Common App
The ease of digital submission has fostered the belief that submitting an application with a few clicks carries no downside. However, applying to institutions without deep research or genuine interest wastes financial resources and valuable time. Furthermore, it dilutes the energy needed to craft compelling, personalized applications for primary targets. A student should only apply to institutions they would genuinely be excited to attend.
Strategic Synthesis
Ultimately, there is no single, mathematically perfect number of college applications that applies to every student. The target list size is a highly personalized calculation that must reconcile an applicant’s academic profile, programmatic interests, financial constraints, and psychological tolerance for risk.
Rather than chasing an arbitrary numerical target, students should aim to construct a highly curated portfolio that maximizes viable, high-quality options. A perfectly structured list is one that is diverse, balanced, and affordable. By carefully managing their application portfolio, students can avoid the pitfalls of application inflation, reduce stress, and ensure a successful transition to higher education.